
Page 402 - Contributed Paper Session (CPS) - Volume 2
P. 402
CPS1900 Ágnes P.
On the next chart it can be seen that activity during the CAWI period
showed periodicity (Figure 2.). The least active day was Saturdays, but
weekend started on Friday. Response rate was the lowest on the last 3 days of
the week. The time of the reminder emails are also indicated on the figure by
points. They also helped to increase the completion of the questionnaire on
the following days.
Figure 2. CAWI respondents per day during the two-week period (green
bars are week-ends)
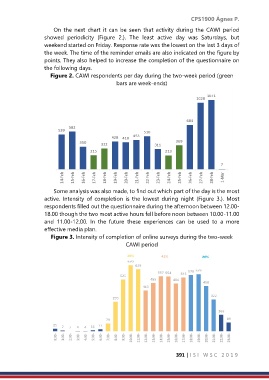
Some analysis was also made, to find out which part of the day is the most
active. Intensity of completion is the lowest during night (Figure 3.). Most
respondents filled out the questionnaire during the afternoon between 12.00-
18.00 though the two most active hours fell before noon between 10.00-11.00
and 11.00-12.00. In the future these experiences can be used to a more
effective media plan.
Figure 3. Intensity of completion of online surveys during the two-week
CAWI period
391 | I S I W S C 2 0 1 9